1. Using your CSUEB Faculty/Staff into Google Analytics and find the CSUEB Main Site - GA4 Property homepage.
Notes:
- If you have not asked for Google Analytics access you must request this access.
- If you have access to other Google Analytics properties be sure to pick the correct property named CSUEB Main Site - GA4 Property.

2. Once you are on the homepage, go to the side menu and select "Reports."

3. Once on the Report Page navigate your way to the Page and Screens under Reports > Life Cycle > Engagment > Pages and Screens
Once navigating your way to "Pages and Screens" you will be greeted with a data table including CSU East Bay's Top 10 sites.

4. Now to apply a filter for the data you are looking for. For this you will need to get rid of the existing filter; “Hostname exactly matches…”. Do this by clicking the x button next to the filter to delete it. Then you will want to add a filter.


5. Once clicking the Add Filter+ button you'll be met with a menu on the right hand side of your screen. To get the landing page + query string you will need to build a dimension.

First click on the select dimension drop down menu. Next scroll down to the Page / Screen section and choose the option landing page + query string.

Now for this example we will use the baycard site and the page pathing possible from it. So we will select the match type contains

We only need the path of the site we'd like to get data from. Below is what we will be putting into our dimension values to narrow down our search, using your department websites site path: Example: /baycard/
Note: Please assure that there is "/" place at the begining and end of the string that will be placed into Dimension Values.
Once that is all done press the apply button to apply the filter.


6. As seen below, We used the example: /baycard/ to narrow down the search results to the data we want that being the baycard pathing.

7. Now to visualize the page path and screen class on the report we will need to add a segment.
Next to the default segment “Page title and screen class” you will see a plus sign. Click this to add a segment.

A menu will appear and you will want to navigate to the tab of “Page / Screen”.

Once you click on this tab choose the option “page path and screen class” Once you click this option the report should update with the page path and screen class being visually represented on the report.


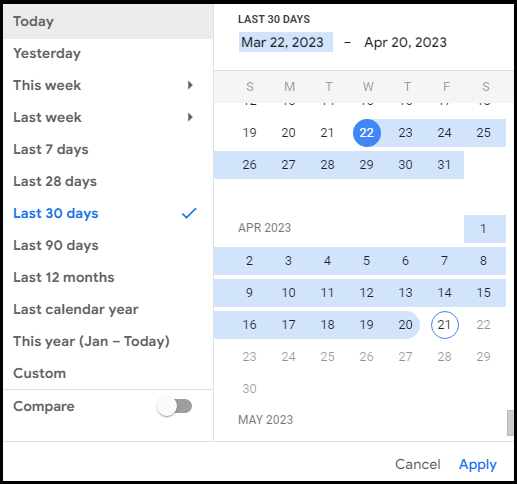
8. Note the date range currently selected and the different options available. This is imperative to aqcuire the correct data you want.


9. Once you have your data set you can export this report to either a sharable link or a choice between PDF or CSV.

You'll notice a few differences in the data with the new Google Analytics 4 Universal Analytics displayed Pageviews, Visits, Unique Pageviews, Average Time on Site, and Bounce Rate.With Google Analytics 4, you'll see:
- Views
- Sessions
- Users
- Engagement Rate
- Average Engagement Time
Automated e-mail reports are no longer an option with Google Analytics 4 as it was with Universal Analytics. You will need to use the tutorial above to view your site specific data. You can find more about comparing metrics between Universal Analytics and Google Analytics 4 within Google's Documentation: https://support.google.com/analytics/answer/11986666#bounce_rate_vs_engagement_rate&zippy=%2Cin-this-article